The Sessions list gives you a focused toolbar to find the recordings that matter: a time-range selector, a search box, and per-session issue badges that highlight errors and frustration at a glance.
Open it from the Sessions tab inside a website's dashboard (Audience → Sessions), or from the standalone Sessions page in the sidebar.
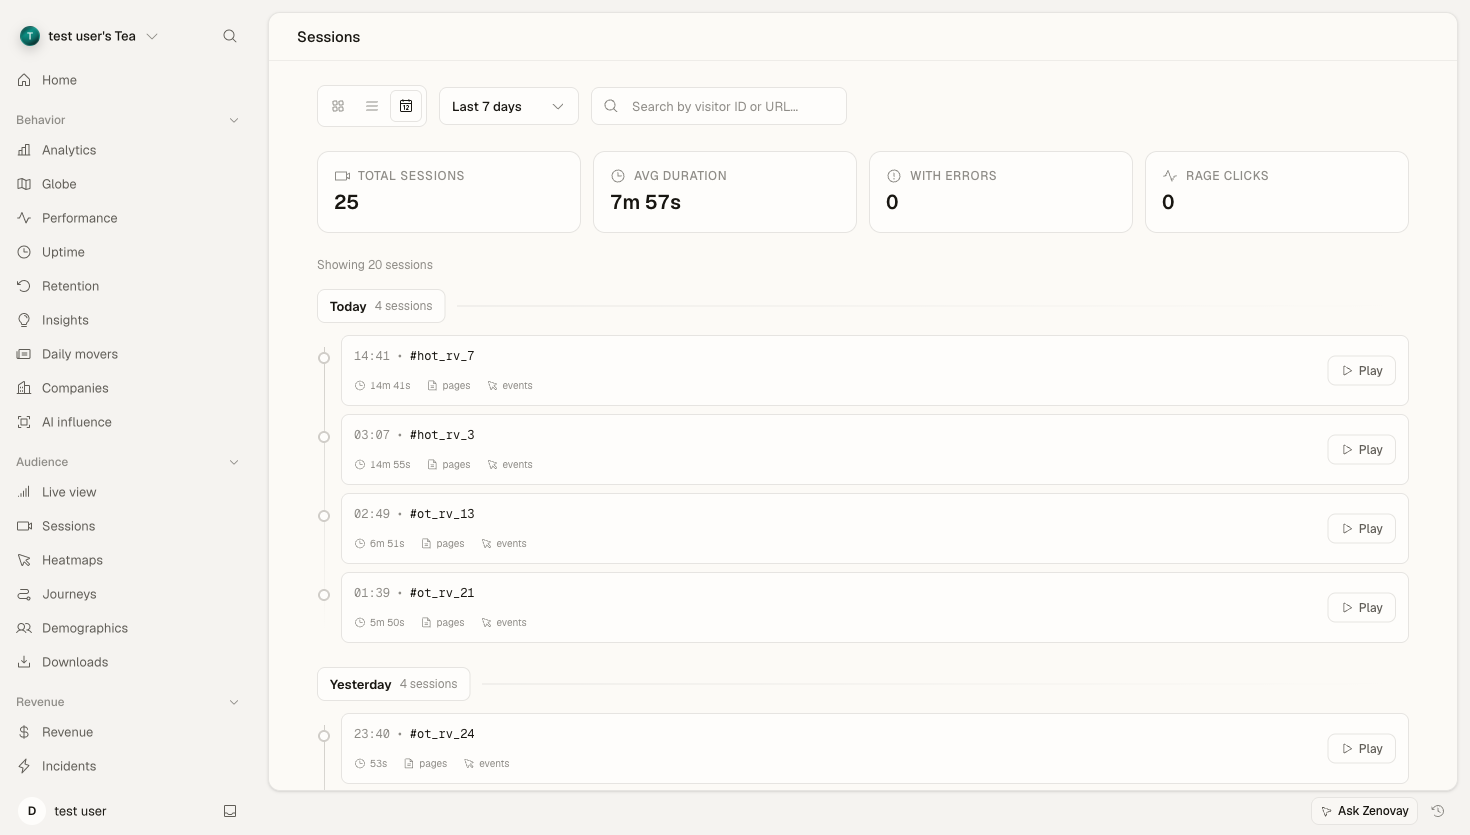
The Sessions Toolbar
The toolbar above the list has three controls:
| Control | What it does |
|---|---|
| View toggle | Switch between Timeline, Cards, and Table layouts |
| Time range | Choose how far back to look |
| Search | Find sessions by visitor ID or page URL |
View Toggle
Pick the layout that suits how you're scanning:
- Timeline — sessions grouped by day, newest first (the default)
- Cards — a two-column grid with a preview placeholder per session
- Table — a compact, sortable-feeling row layout for dense scanning
On phones the list opens in Cards view by default.
Time Range
Filter the list to a look-back window:
| Range | Selection |
|---|---|
| Today | Current day |
| Yesterday | Previous day |
| Last 7 days | Week view |
| Last 14 days | Two weeks |
| Last 30 days | Month view |
| Last 90 days | Quarter view |
| Last 6 months | Half-year view |
How far back you can look depends on your plan, because recordings are deleted once they pass your replay retention window:
| Plan | Replay look-back |
|---|---|
| Free | No session replay |
| Pro | 60 days |
| Scale | 120 days |
| Enterprise | 180 days |
Ranges beyond your plan's window stay visible with a lock icon. Selecting one opens an upgrade prompt rather than returning empty results.
Searching Sessions
The search box matches against two fields:
- Visitor ID — the short identifier shown on each session (the last 8 characters)
- Page URL — the page the session started on
Type any part of a visitor ID or a URL path and the list filters instantly as you type. For example, typing checkout surfaces sessions that started on a URL containing "checkout", and typing the tail of a visitor ID jumps straight to that person's recordings.
Info
Search is a simple text match on visitor ID and starting URL. There is no field-query syntax, boolean operators, or saved-segment system in the Sessions list today. To analyze behavior across many sessions, use the dashboard's Heatmaps, Journeys, and Insights tabs.
Reading the Issue Badges
Every session in the list carries badges that flag problems, so you can spot the recordings worth watching without opening each one:
| Badge | Meaning |
|---|---|
| Error count | The session recorded one or more JavaScript errors |
| Frustration | The session showed frustration signals such as rage clicks |
Sessions with issues are subtly highlighted in every view (a red dot on the timeline, a tinted card border, an icon in the table). The stats grid at the top of the page summarizes the current range: total sessions, average duration, sessions with errors, and rage clicks.
Tips
Start Wide, Then Narrow
- Pick a time range that covers the period you care about.
- Scan the issue badges and the stats grid for the kinds of sessions you want.
- Use the search box to zero in on a specific URL or visitor.
Follow the Errors
The sessions with errors stat and the per-row error count are the fastest way to find broken experiences. Sort your attention toward the highlighted sessions first.
Use the Right Surface for the Job
Session replay is for watching individual journeys. For aggregate behavior, pair it with:
- Heatmaps — where visitors click, move, and scroll
- Journeys — the paths visitors take through your site
- Insights — automatic findings across your traffic