Learn how Zenovay groups similar errors together to reduce noise and speed up debugging.
Where to find error groups
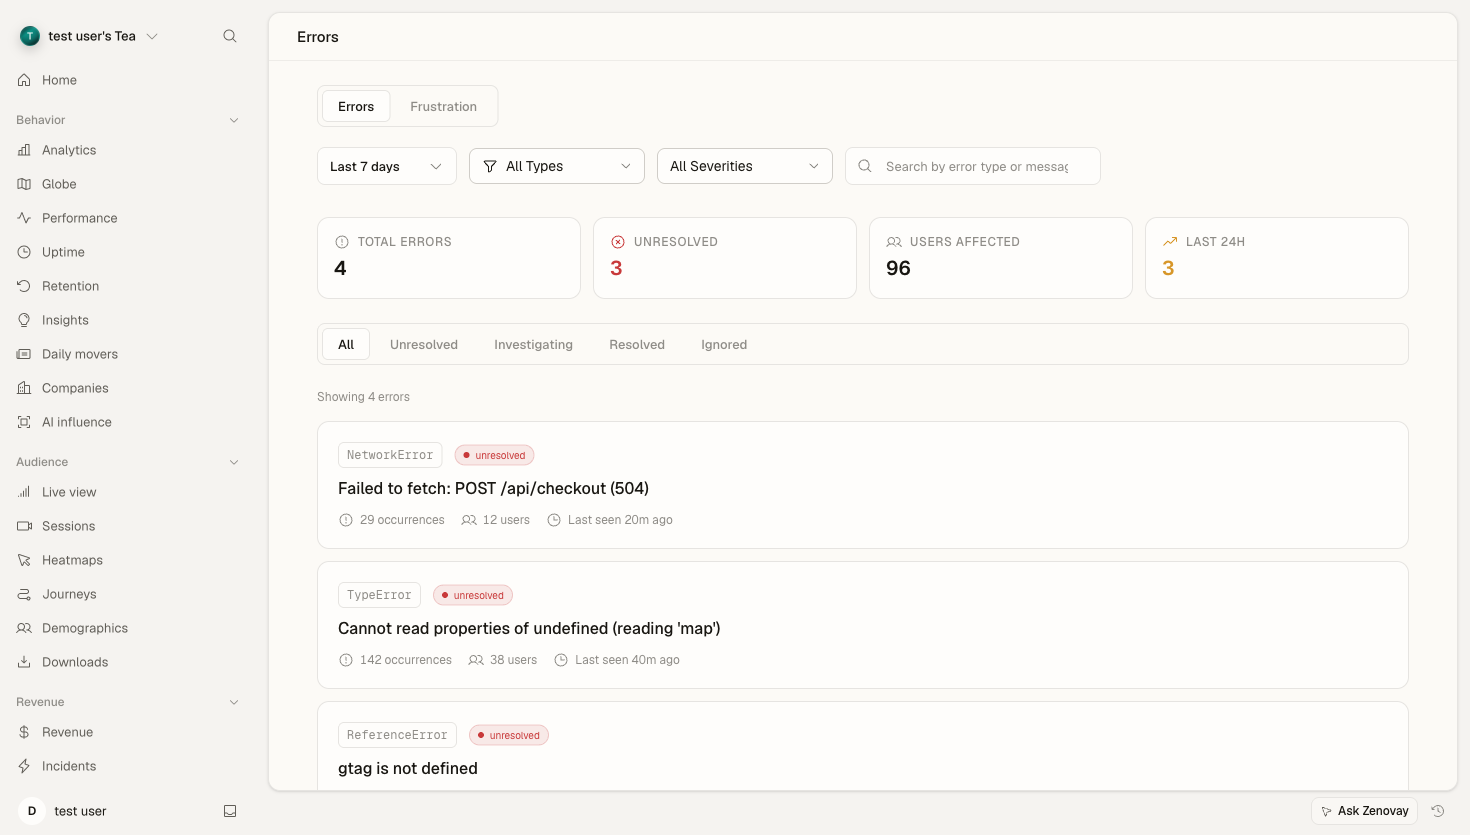
Open your website's dashboard from Domains, then select the Errors tab. The tab has two sub-tabs:
- Errors — the grouped list of JavaScript and network errors (this article).
- Frustration — rage clicks, dead clicks, and other frustration signals.
Error tracking is available on the Pro plan and above.
How Error Grouping Works
Grouping by fingerprint
Instead of showing every individual occurrence, Zenovay collapses identical errors into a single group using a fingerprint derived from:
- Error type — TypeError, ReferenceError, etc.
- Error message — the message pattern
- Stack trace — the top frames of the call stack
Two occurrences with the same fingerprint land in the same group, so a single recurring bug shows up once with an occurrence count, not thousands of times.
Example
These two occurrences are grouped together:
// Error 1: User ID 123
TypeError: Cannot read property 'name' of undefined
    at getUserName (user.js:45:12)
    at renderProfile (profile.js:78:5)

// Error 2: User ID 456
TypeError: Cannot read property 'name' of undefined
    at getUserName (user.js:45:12)
    at renderProfile (profile.js:78:5)
Same group because:
- Same error type (TypeError)
- Same message
- Same stack trace location
Error Group List
Each group in the list shows:
| Metric | Description |
|---|---|
| Occurrences | Total times the error fired |
| Users | Unique visitors affected |
| First seen | When the group was first recorded |
| Last seen | Most recent occurrence |
| Category | JavaScript, Network, Resource, or Custom |
| Severity | Critical, High, Medium, or Low |
| Status | Unresolved, Investigating, Resolved, or Ignored |
Group Detail Panel
Click a group to open its detail panel, which includes:
- Sample occurrences — full details (message, stack frames, breadcrumbs) for recent instances
- Frequency chart — occurrences over time
- Affected pages — where the error occurs most
- Browser & device breakdown — which browsers, operating systems, and devices are affected
- Insights — category-specific guidance on why the error happens, where to look, and how to fix it
Info
Upload source maps so minified production stack traces resolve back to your original source files. See Source Maps & JS Errors.
Error Status Workflow
Status Types
| Status | Description |
|---|---|
Unresolved | New or still-open errors — the default |
Investigating | You're actively looking into it |
Resolved | The fix is deployed and the error should stop |
Ignored | Known issue you don't plan to fix (e.g. third-party noise) |
Changing Status
From an error group's detail panel, use the status buttons to mark it Investigating, Resolved, or Ignored. Marking a group Resolved or Ignored removes it from the default Unresolved view so your list stays focused on what's actually open.
Changing status requires a team role with edit access to the website. Viewers can browse error groups but can't change their status.
Filtering & Searching
The error list can be narrowed with:
| Filter | Options |
|---|---|
| Status | All, Unresolved, Investigating, Resolved, Ignored |
| Category | JavaScript, Network, Resource, Custom |
| Severity | Critical, High, Medium, Low |
| Date range | Today, Yesterday, 7 / 14 / 30 / 90 days, All time |
A search box filters groups by error message or type. The available date ranges depend on your plan's data-retention window.
Suppressing Noisy Groups
If a group is pure noise (a one-off from a browser extension, say), mark it Ignored from its detail panel. Ignored groups drop out of the default Unresolved view so your list stays focused, but their history is kept in case you want to revisit it later. If you change your mind, switch the status back to Unresolved or Investigating.
Best Practices
Triage Workflow
- Review regularly — check Unresolved errors as part of your routine.
- Prioritize by impact — a group affecting many users usually matters more than raw occurrence count.
- Quick wins first — resolve easy fixes immediately to cut the noise.
- Use status consistently — keep the Unresolved list to things that genuinely need attention; ignore known third-party noise.
- Watch for spikes — set up performance alerts so you hear about new error spikes proactively.
Effective Grouping
- Keep source maps current so stack traces stay readable.
- Use consistent, descriptive error messages in your code.
- Add context to manually tracked (custom) errors.
Troubleshooting
Too Many Groups
Causes:
- Highly dynamic error messages (lots of variable data in the message text)
- Missing source maps
- Third-party script errors
Solutions:
- Use stable, normalized error messages
- Upload source maps
- Mark third-party noise as Ignored
Errors Not Grouping
Check:
- A stack trace is available on the error
- The errors share the same source location
- The error type and message match